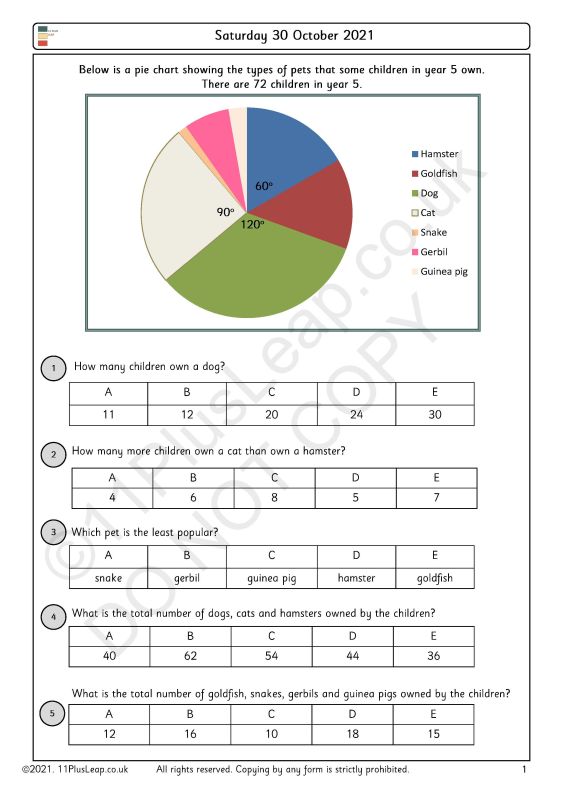
In Week 2 we focused on pie charts in our sessions and most students were comfortable enough with them when values were prescribed to certain segments. It was a simple method of adding or subtracting and figuring out the answers from there. That seems easy enough!
However, when we challenged them by giving them pie charts that were labelled with degrees instead, they found it much more tricky. Tackling these requires a two-step approach that they weren’t used to with pie charts with values. Once we take the problem and break it down, it is far simpler.
For example, we’re given a pie chart that is showing which teams people support in a football club. There are 60 club members. One segment is labelled 180˚ and symbolises the number of Manchester United fans.
The first step is to figure out what the values of the degrees are. A pie chart is a circle and, therefore, we know that it measures 360˚. We also know that 180˚ is half of 360˚. So, we take all 60 of the club members and halve that number, which is 30. This way, we know that the segment labelled 180˚ is symbolising the fact that 30 of the club members are Manchester United fans.
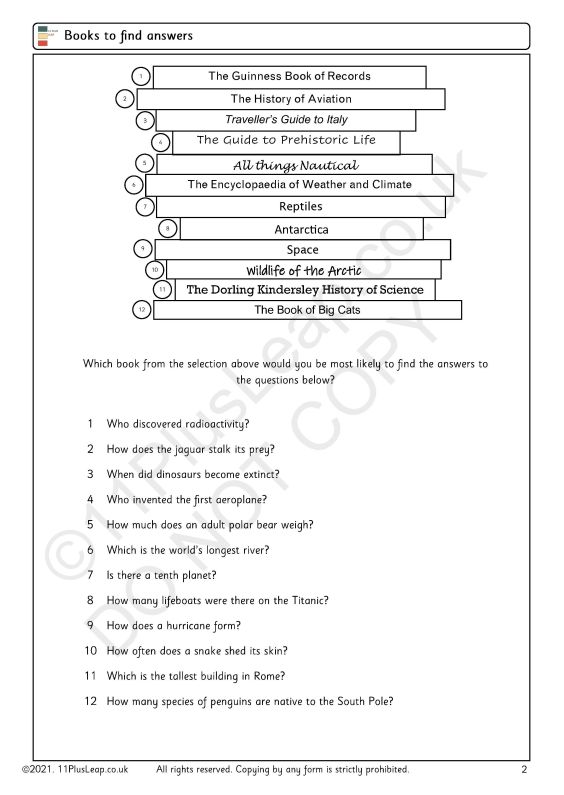
To test their knowledge of pie charts labelled with degrees, we’ve attached an exercise. We also have an extra exercise that’s just a bit of fun. It’s a great way to stimulate educational discussion with your children!


